Running an A/A (aa) Test using Sidecar
In this guide, we will walk you through how to leverage Statsig’s sidecar to run an A/A test on your product.
Why run an A/A (aa) test?
There are many reasons to run an A/A test, one of the most common being to validate a new experimentation engine you may be integrating with (in this case Statsig). For new users just getting started with Statsig, we often recommend running an A/A test to provide a “low-stakes” first test environment, ensuring that you’ve got your metrics set up correctly and are seeing exposures flowing through as expected before kicking off your first real A/B test.
How to run an A/A test
Step 1: Create a new Experiment in Sidecar
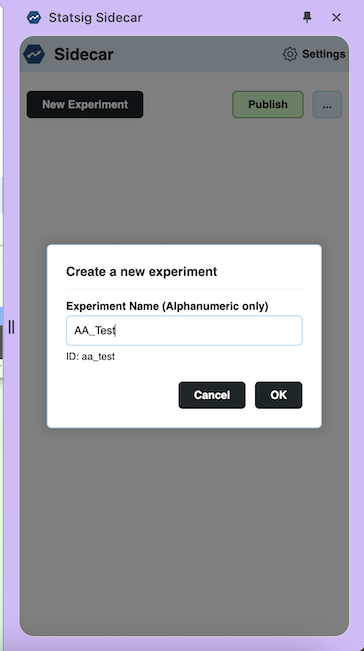
Navigate to the page on your website that you want to run an A/A Test. Open the Statsig Side car extenstion and click on 'New Experiment'. Fill in the title of your A/A test.
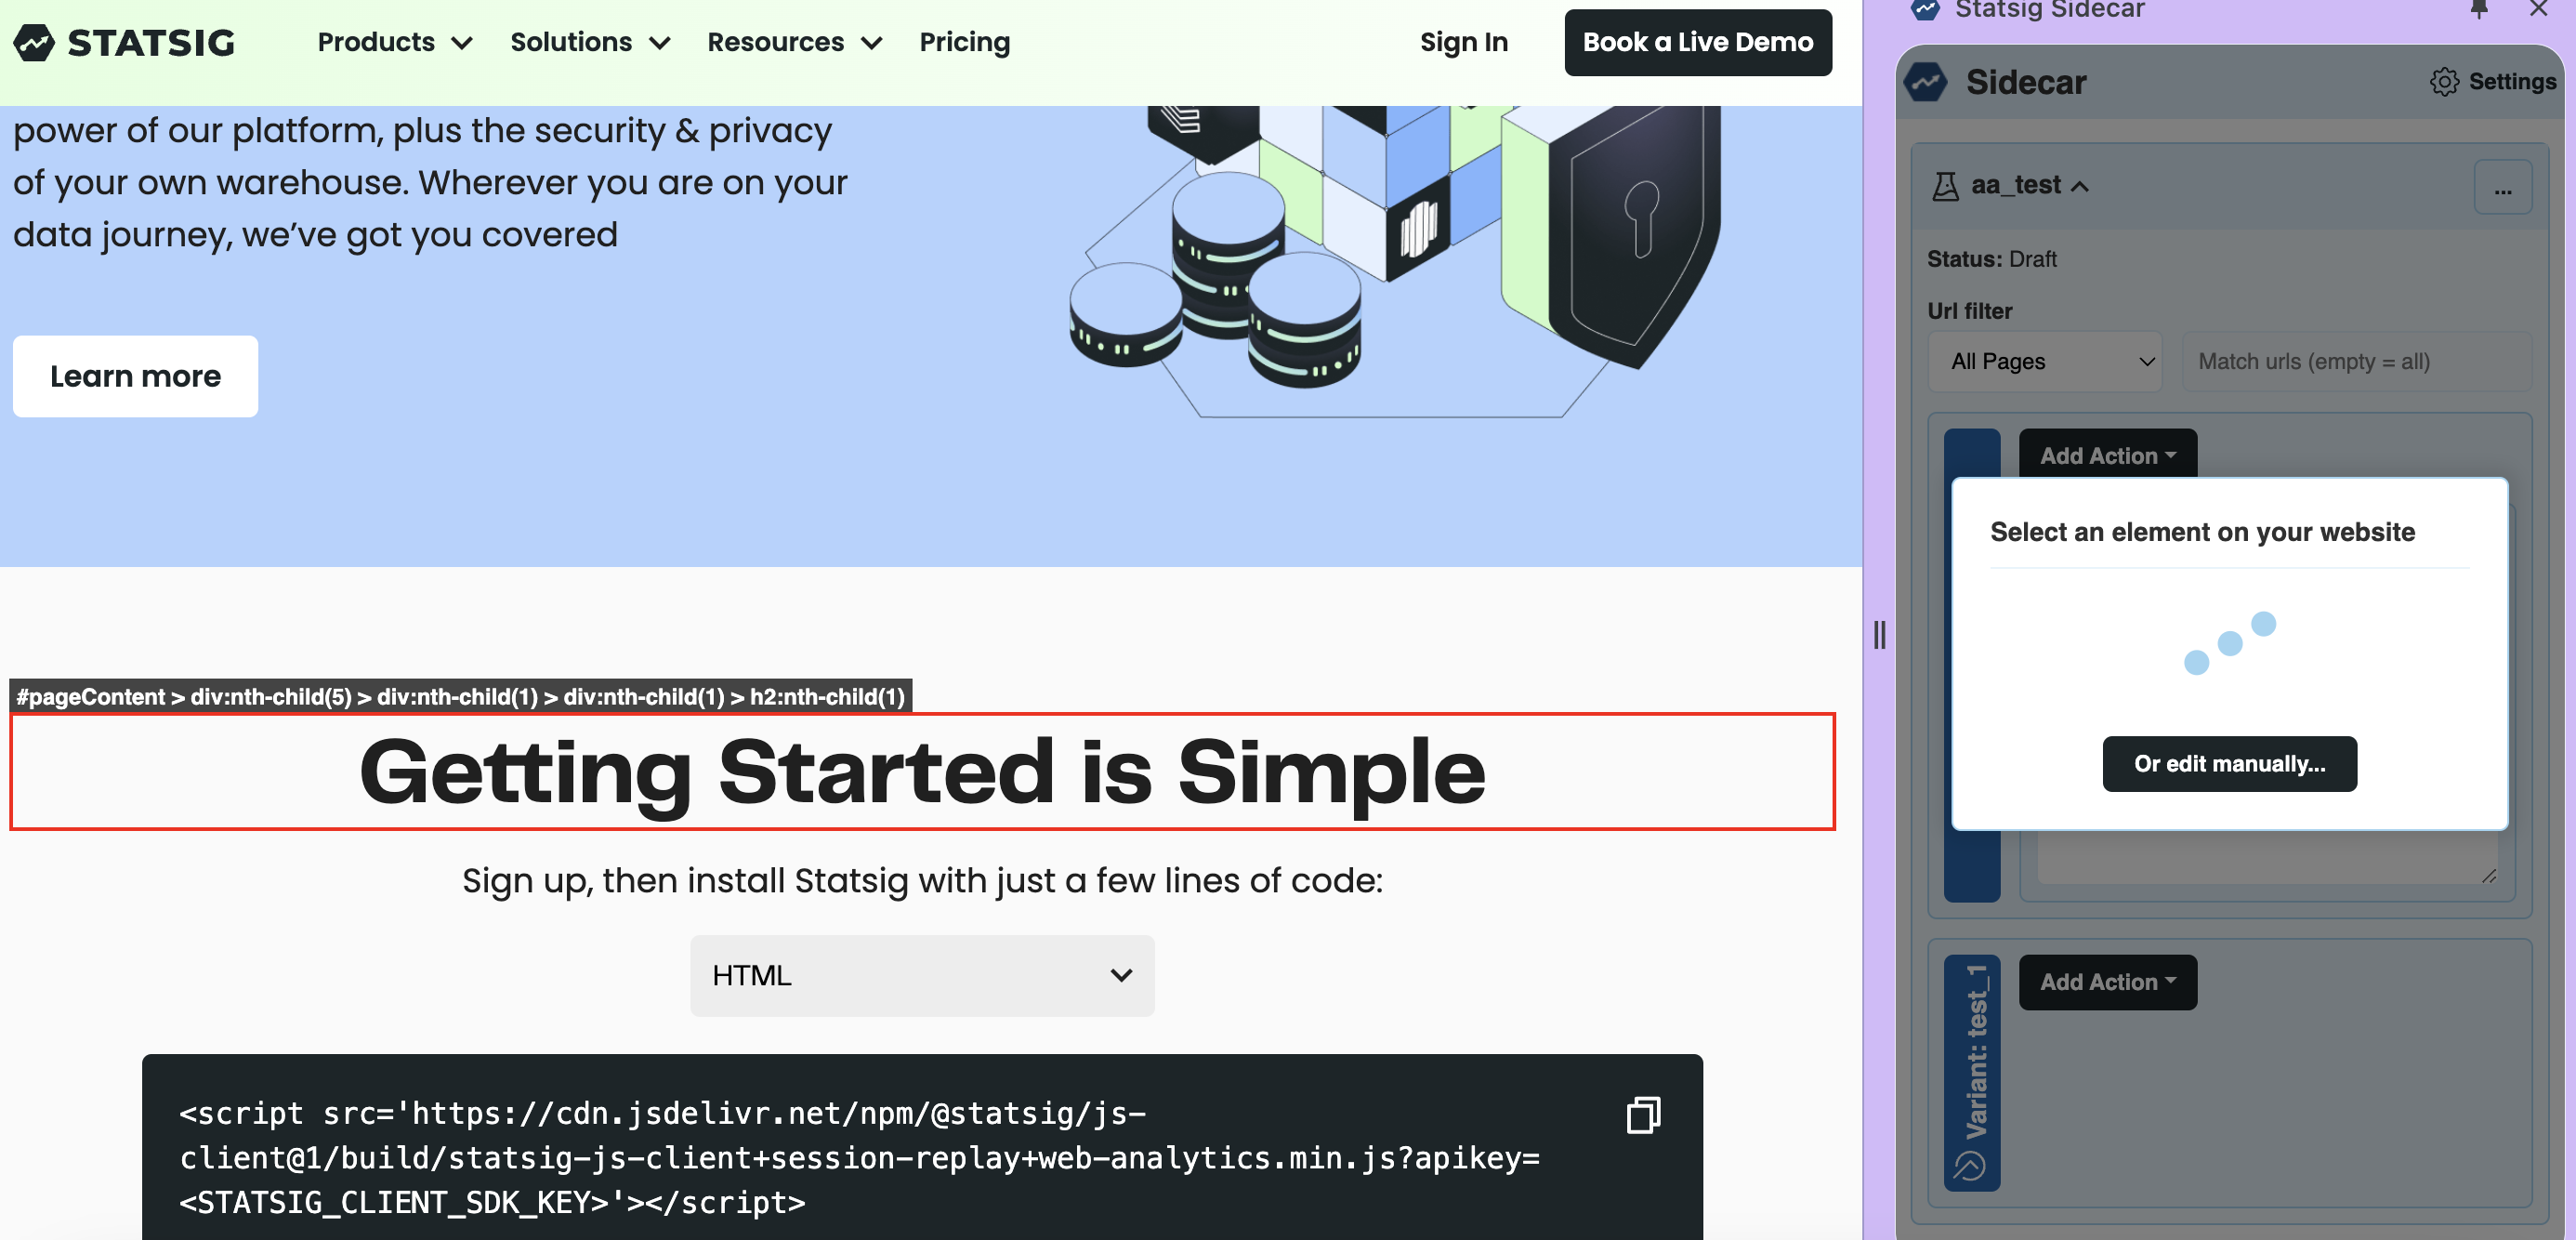
Then, determine of the URI filter (i.e. All Pages, contains, etc.). After you have configured the URI, it is time to set up the variants.
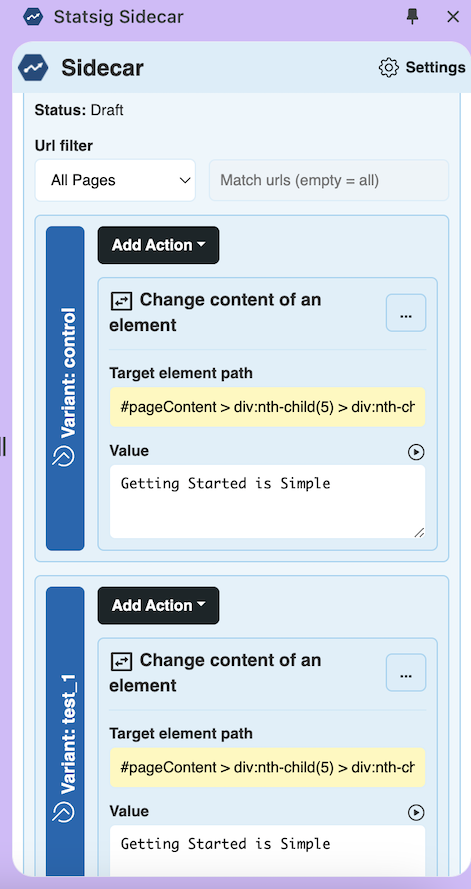
With the variant 'Control', pick an action. In this example we are simply changing the content of an element, specifically the title, 'Getting Started is Simple'.
Repeating the step above, you'll do the exact same action for the variant 'Test'. Your set up should look like the following.
From there, all you'll need to do is click 'Publish', this will push out the experiment to Statsig as a draft.
Step 2: Configure Experiment Scorecard in Statsig Console
Once the experiment is pushed out to end users, you will need to edit the scorecard to your experiment within the console. Navigate to the console, click on the Experiments tab, and go into the experiment you just created.
In the Setup tab, you can fill out the scorecard for the experiment Hypothesis, and any primary metrics you are interested in watching. While Statsig will show you experiment results for all your metrics, these key metrics represent your hypothesis for the experiment. Establishing a hypothesis upfront ensures that the experiment serves to improve your understanding of users rather than simply serving data points to bolster the case for shipping or not shipping your experiment.
In the Allocation and Targeting section, for an AA test, we recommend to allocate 100% of users to the experiment while targeting everyone.
Then, make sure to save and push your experiment. Your test is now set up to start measuring metrics associated with the A/A Test!
Step 3: Review A/A test results
Within 24 hours of starting your experiment, you'll see the cumulative exposures in the Pulse Results tab of your experiment.
his will break down your logged exposures (as well as the distribution of the logged exposures). If something looks off, check the Diagnostics tab for more granular, day-by-day exposure breakdowns at both the Checks and User level.
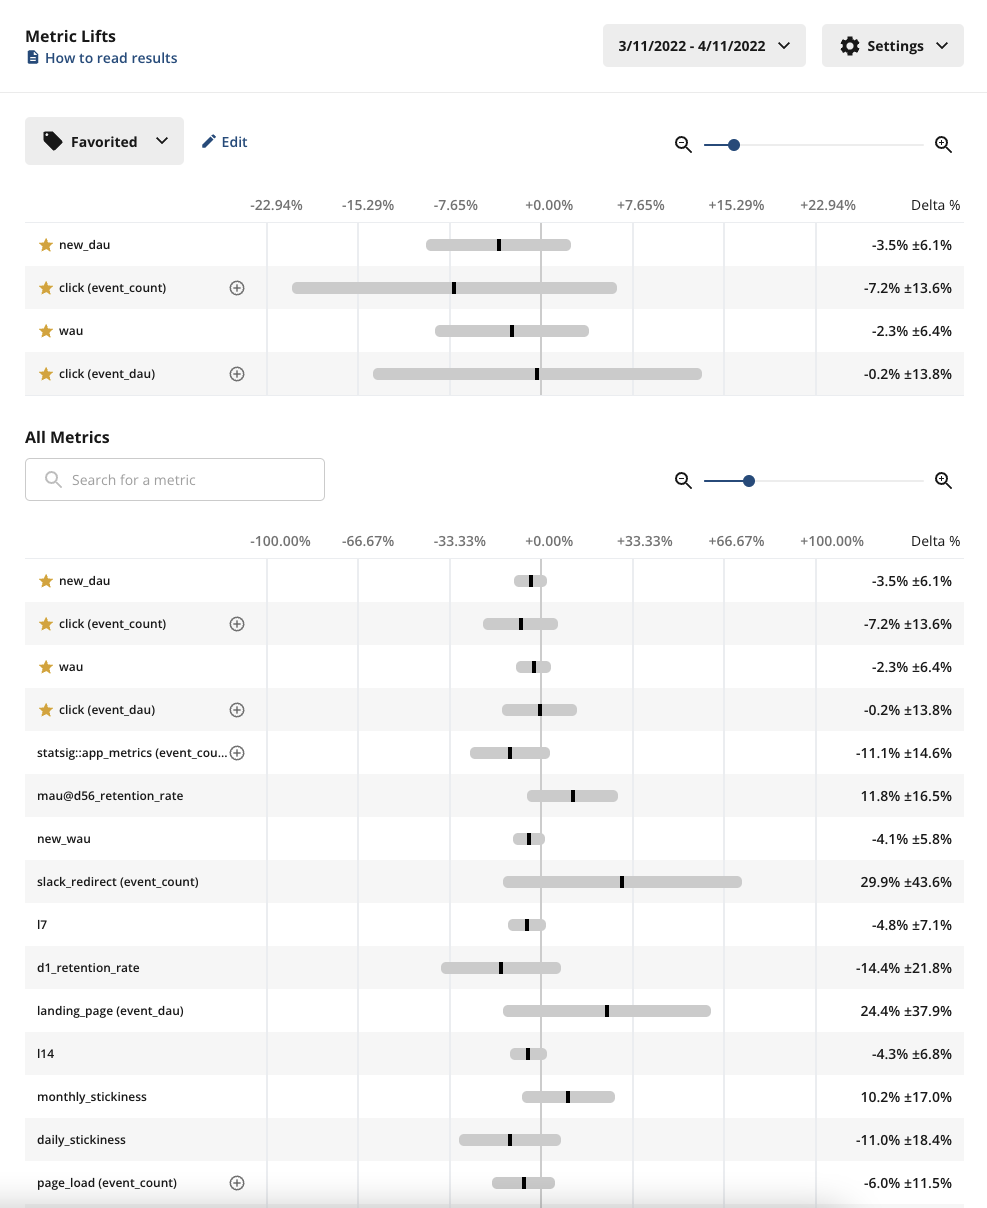
In the Scorecard panel, you can see the full picture of how all your tagged metrics are performing.
What should you expect to see?
- Exposures- make sure you’re seeing exposures flowing through as expected from your product. If you’re not seeing exposures, use the Diagnostics tab and the Exposure Stream to debug
- Pulse results- roughly 5% of your metrics in Pulse should be showing a statistically significant change due to the 95% confidence interval of Statsig’s stats engine
We recommend running your A/A long enough to reach most of your weekly active users, or at least a week.